
Page 9 - NBAGR NEWSLETTER VOL 16 No 1 (OCT 2019 - JUNE 2020)
P. 9
Bhangor buffalo of Tripura Nagavali sheep of Andhra Pradesh
Physical, body biometric traits of Phenotypic characterization and
adult male and female buffaloes was evaluation was carried out for a native
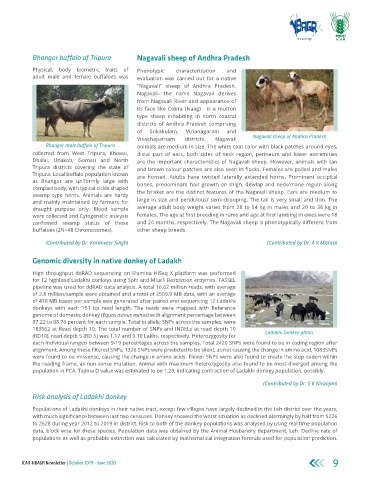
“Nagavali” sheep of Andhra Pradesh.
Nagavali- the name Nagavali derives
from Nagavali River and appearance of
its face like Cobra (Naag) - is a mutton
type sheep inhabiting in north coastal
districts of Andhra Pradesh comprising
of Srikakulam, Vizianagaram and
Visakhapatnam districts. Nagavali Nagavali sheep of Andhra Pradesh
Bhangor male buffalo of Tripura animals are medium in size. The white coat color with black patches around eyes,
collected from West Tripura, Khowai, distal part of ears, both sides of neck region, perineum and lower extremities
Dhalai, Unakoti, Gomati and North are the important characteristics of Nagavali sheep. However, animals with tan
Tripura districts covering the state of and brown colour patches are also seen in flocks. Females are polled and males
Tripura. Local buffalo population known are horned. Adults have twisted laterally extended horns. Prominent occipital
as Bhangor are uniformly large with bones, predominant hair growth on thigh, dewlap and neck/mane region along
compact body, with typical sickle shaped
swamp type horns. Animals are hardy the brisket are the distinct features of the Nagavali sheep. Ears are medium to
and mainly maintained by farmers for large in size and pendulous/ semi-drooping. The tail is very small and thin. The
draught purpose only. Blood sample average adult body weight varies from 28 to 54 kg in males and 20 to 38 kg in
were collected and Cytogenetic analysis females. The age at first breeding in rams and age at first lambing in ewes were 18
confirmed swamp status of these and 24 months, respectively. The Nagavali sheep is phenotypically different from
buffaloes (2N=48 Chromosomes). other sheep breeds.
(Contributed by Dr. Karanveer Singh) (Contributed by Dr. A K Mishra)
Genomic diversity in native donkey of Ladakh
High throughput ddRAD sequencing on Illumina HiSeq X platform was performed
for 12 highland Ladakhi donkeys using Sphl and Mluc1 Restriction enzymes. TASSEL
pipeline was used for ddRAD data analysis. A total 16.62 million reads, with average
of 2.8 million/sample were obtained and a total of 2509.9 MB data, with an average
of 418 MB bases per sample was generated after paired end sequencing 12 Ladakhi
donkeys with each 151 bp read length. The reads were mapped with Reference
genome of domestic donkey (Equas asinus asinus) with alignment percentage between
97.22 to 98.76 percent for each sample. Total bi allelic SNPs across the samples, were
183562 at Read depth 10. The total number of SNPs and INDELs at read depth 10
(RD10), read depth 5 (RD 5) was 1.17 and 0.10 Lakhs, respectively. Heterozygosity for Ladakhi Donkey photo
each individual ranged between 9-19 percentages across the samples. Total 2420 SNPs were found to be in coding region after
alignment. Among these filtered SNPs, 1326 SNPs were predicted to be silent, as not causing the change in amino acid, 1083SNPs
were found to be missense, causing the change in amino acids. Eleven SNPs were also found to create the stop codon within
the reading frame, as non-sense mutation. Animal with maximum heterozygosity also found to be most diverged among the
population in PCA. Tajima D value was estimated to be 1.29, indicating contraction of Ladakhi donkey population, possibly.
(Contributed by Dr. S K Niranjan)
Risk analysis of Ladakhi donkey
Populations of Ladakhi donkeys in their native tract, except few villages have largely declined in the Leh district over the years,
with much significance between last two censuses. Donkey showed the worst situation as declined alarmingly by half from 5226
to 2628 during year 2012 to 2019 in district. Risk to both of the donkey populations was analysed by using real time population
data, block wise for these species. Population data was obtained by the Animal Husbandry department, Leh. Decline rate of
populations as well as probable extinction was calculated by mathematical integration formula used for population prediction.
ICAR-NBAGR Newsletter | October 2019 - June 2020 9